• SERVICES
  • INDUSTRIES
  • PERSPECTIVES
  • ABOUT
  • ENGAGE

INFRASTRUCTURE

by EOS Intelligence EOS Intelligence No Comments

2014 FIFA World Cup Brazil – A Squandered Opportunity

3kviews

After 7 years of preparations, Brazil hosted the most expensive FIFA World Cup in 2014 at a cost that totaled billions of dollars. What is the associated outcome of spending huge sums on World Cup preparation? Did the investment leave any positive legacy for the country? What is the economic impact of hosting the World Cup on Brazil?

Investment and Associated Outcome

Investment in projects considered essential to hosting World Cup in 2014 varied across a range of sectors and had different impact on each of them. Around US$12.9 billion were invested in numerous projects focused on urban mobility, airports, stadiums, tourism, ports, telecommunication, and security between 2007 and 2013.
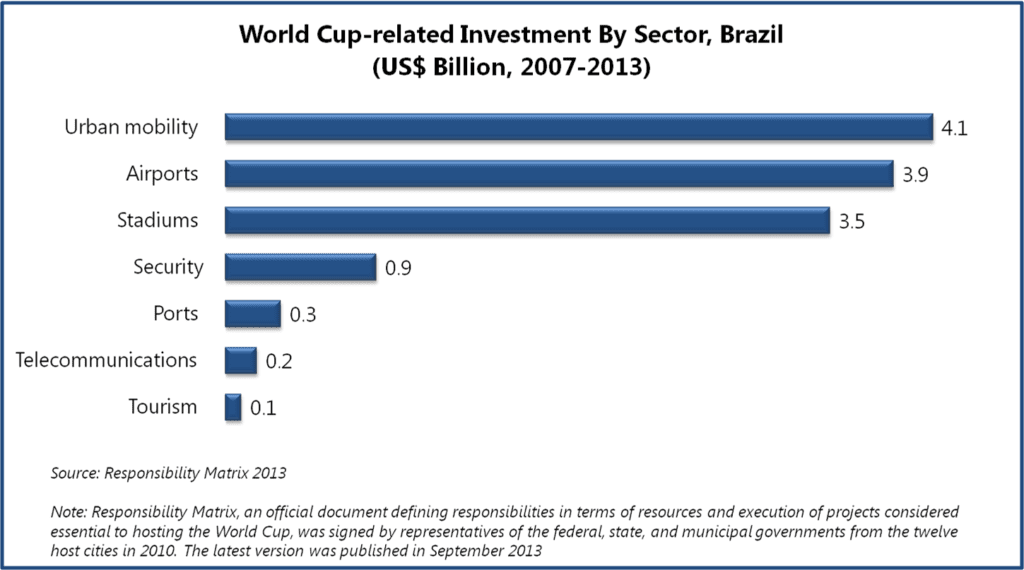
World Cup-related Investment By Sector, Brazil

Urban Mobility

Brazil has been struggling with overcrowded urban transportation systems for years. The insufficient public systems, paired with Brazilians’ growing financial capabilities, resulted in an increase in personal vehicles use, which in turn triggered chaotic and congested traffic conditions across Brazil’s major cities. 2014 World Cup investments planned in relation to urban mobility were expected to leave positive legacy for the country and to improve transportation systems in metropolitan cities easing traffic problems. But, several delays (caused by corruption, financing problems, etc.) were observed in execution of the planned urban mobility projects during 2007-2012, long before the event. Furthermore, as the World Cup neared, the government’s focus transferred to stadium construction works, as six out of the proposed twelve stadiums for 2014 World Cup still remained incomplete a year before the tournament. According to Responsibility Matrix 2013, investments dedicated to urban mobility projects were cut down to US$4 billion from US$6.6 billion anticipated in 2010. Some 21 of 53 projects planned in 2010 were discarded from the Matrix in 2013. Transformative advancements in transit infrastructure were expected to be the most beneficial outcome from hosting the mega sporting event. But with time, the priorities for government changed, and many of the ambitious projects never took off, as was the case with the proposed project for building high speed train linking Rio and Sao Paulo that was never executed.

Moreover, as the required urban mobility projects remained unfinished during the tournament, government declared holidays in schools and businesses on game days to ease traffic congestion. In June 2014, Sao Paulo State Federation of Commerce, a representative of 155 trade and business unions, estimated that the cost of lost productivity and overtime pay for businesses that remained inoperative during games would be around US$5 billion.

Furthermore, experts allege that these urban mobility projects were approved hastily without giving much thought to long-term benefits, which represents an intangible opportunity cost. For instance, some of the host cities, such as Sao Paulo, Manaus, Salvador, and Porto Alegre, were not allotted any investments in transport infrastructure. In most host cities, the mobility projects were limited to Bus Rapid Transit lines and there were no plans to invest in light rail, metro, or ferry lines.

Airports

An estimated investment of US$3.9 billion was designated to airports, out of which US$2.9 billion were contributed by private sources. These investments led to a noticeable improvement in airport infrastructure and facilities. An assessment report, published in July 2014, by President Dilma Rousseff and the Minister of Civil Aviation Moreira Franco indicated that around 16.7 million passengers used airport services in Brazil during the tournament. In addition, annual passenger capacity at airports increased by 52% over 2013 capacity level, reaching 67 million passengers per year. Between 2007 and 2014, aircraft yards were increased by 1,360 m², passenger terminals were increased by 350,000 m² and 54 new boarding gates as well as 10,300 parking slots were built. Modernized infrastructure and increased capacity will remain as positive legacy for the country.

Stadiums

Between 2007 and 2014, Brazil constructed five new stadiums, renovated five stadiums, and demolished and rebuilt two stadiums for 2014 World Cup. The estimated cost of construction and renovation of the proposed twelve stadiums for hosting 2014 World Cup game increased to US$3.5 billion, up from US$1.2 billion projected in 2007. Public opinion was outraged at these inflated costs, especially that they were paired with un-kept promises once given by the government representatives. After winning the bid to host the World Cup in October 2007, the former Sports Minister Orlando Silva promised, “There won’t be one cent of public money used to build stadiums”. However, according to Responsibility Matrix 2013, the contribution by private sources for building and refurbishing stadiums stood only at US$61.3 million, so majority of the costs were borne by federal investments and state and municipal governments. Another issue associated with the construction of large stadiums is its effect on urban real estate. Each newly built facility is spread across around 15 to 20 acres of urban land, making the space unavailable for any other, perhaps more productive, purposes. It is likely to also continue to negatively affect the real estate prices, especially, as urban land is scarce in Brazil.

Post 2014 World Cup, some cities, which received large stadiums built specifically for the tournament at capacities far exceeding local, every-day needs, are struggling to make these facilities economically viable. In particular, the stadiums built in Manaus, Natal, Cuiaba, and Brasilia appear to be under the fear of turning into ‘white elephants’. These cities have football teams playing in Brazil’s third-fourth division championships, which are not expected to attract the audience at volumes close to the stadiums’ capacities. Moreover, if government fails to find private sponsors for these stadiums, hefty maintenance costs will have to be paid from public funds. The newly built US$325 million stadium in Manaus alone is expected to demand US$3 million for annual maintenance.

Security

In June 2013, mass protests were held across the country during Confederation Cup, a warm-up tournament organized by FIFA to test stadiums, transportation, and security before 2014 World Cup, to express frustration over exorbitant spending by government on World Cup while Brazil still struggled with below par standards of healthcare and education. The protests turned violent with police crackdown and arrests. Following the event, Brazil’s government became alert and tightened up the security measures for the 2014 World Cup to ensure safety of the visitors. 177,000 security personnel were deployed during the tournament and US$900 million were invested in security structures, equipment, and training. Such high spending on security might not have been required if the government had addressed the problems of the country’s citizens in time, or at least had exhibited more understanding attitude to these sensitive in nature social problems.

Ports

Around US$322 million were invested in ports. With more than 90% of trade in Brazil routed through ports in 2012, ports are an important medium for international trade in the country. However, the funds allotment for improvement of ports under the header of World Cup-related investment remained limited as the sector was not assumed to directly impact the event. Between 2007 and 2013, funds were mainly used for modernization of port terminals at Salvador, Fortaleza, and Natal.

Telecommunication

During 2007-2013, around US$200 million were invested in improvement and expansion of telecommunication infrastructure in association with World Cup in Brazil. In order to connect the host stadiums and other official venues of the tournament, a 15,000 km long optical fiber network was installed that enabled to handle 166 terabytes of data during the World Cup. Furthermore, 15,012 mobile antennas were installed across the host cities. A report released post 2014 World Cup by SindiTelebrasil, a national union of telephone companies in Brazil, indicated that the telecommunication networks in the country were successful in handling large traffic volumes during the event. For instance, during the World Cup final match, held on July 13, 2014, between Germany and Argentina, the telecommunication networks managed high traffic volume of around to 2.6 million photos, which is equivalent 1,430 gigabytes of data.

Tourism

Post 2014 World Cup, President Dilma Rousseff announced that one million foreign tourists visited the country and three million Brazilian tourists travelled around the country during the event. Around 3.4 million people bought tickets to attend matches at the stadiums. Fan Fests attracted another five million people. By mid-June 2014, a total of 340,000 daily hotel bookings were recorded.

According to data released by Brazil Central Bank in July 2014, international visitors spent US$797 million in Brazil in the month of June 2014. Higher revenues from spending by international tourists in Brazil and reduced foreign trips by Brazilians during 2014 World Cup contributed in improvement of international travel account of services trade, which posted a deficit of US$1.2 billion in June 2014, down 17.3% from June 2013, providing some cushion to current account deficit. Economists believe that current account deficit over 5% of gross domestic product may lead to currency crisis in Brazil involving difficulty in debt repayments and currency depreciation. The twelve-month current account deficit remained stable at 3.6% of gross domestic product in June 2014, at the same level as in August 2013, because of narrowed gap in international travel account of services trade.

A survey conducted by Getúlio Vargas Foundation (FGV) and the Foundation Institute of Economic Research (FIPE), conducted by interviewing 6,627 foreign visitors and 6,038 Brazilians during the World Cup indicated that about a million tourists from 203 different countries came to Brazil during the tournament. Foreign visitors stayed in the country for an average of 13 days and visited 378 Brazilian municipalities. Thus, the event offered an opportunity for the country to promote its less popular tourist destinations to a group of diverse visitors. Furthermore, the survey suggests that 95% of the visitors expressed the desire to revisit, which might indicate brighter days for tourism industry in the future, provided that these tourists actually come back.

A Rocky Road to the Event

A look into World Cup-related investment across these sectors reveals that there have been mixed repercussions of the event across social and economy spheres. However, on a broader level, the planning, preparation, and organization of the event were challenged by a range of problems, which led to lost opportunities or even negative outcomes, and questioned the overall benefit of organizing 2014 World Cup by Brazil.

Increased Costs and Delays

In 2007, Carlos Langoni, then Finance Director of the 2014 World Cup Local Organizing Committee and former President of the Brazil Central Bank, estimated the World Cup-related cost at US$6 billion. In January 2010, Sports Ministry revised the estimates to around US$11 billion. According to the Responsibility Matrix 2013, the estimated actual expenditure was US$13 billion.

The increase in costs is believed to be partially attributed to the rampant political corruption in Brazil. By analyzing Brazil’s electoral data and government audit reports from 2007 to 2013, The Associated Press reported many-fold increase in campaign contributions to the political parties by the construction firms that were awarded most World Cup projects. This is suspected to have been a form of a bribe to win Word Cup-related projects and later allowed these companies to make huge profits by indulging into unfair practices such as fraudulent billing, under-compensation to workers, etc. For instance, Andrade Gutierrez, a construction conglomerate that got large contracts associated with World Cup, increased its political contributions to US$37.1 million in 2012 from US$73,180 in 2008. Adding to the suspicion of possible political linkage of the construction firms involved in World Cup-related projects, in 2014, Contas Abertas, a watchdog group that scrutinizes Brazilian government budgets, alleged that some contracts were awarded directly to the chosen construction firms and were never made available for public bid. A government audit report on construction projects associated with World Cup, released in early 2014, highlights several instances of price-gouging and suspected misuse of financial linkages between the construction firms and government. For instance, Brasilia’s government failed to impose US$16 million fine on Andrade Gutierrez for a five-month delay in completion of the stadium in the city. However, no corruption charges have been filed yet on individuals or companies related to World Cup work.

Additionally, experts believe that the lacking capability of construction firms in project planning and management also contributed to rising costs and delays. Furthermore, in order to accelerate the construction work, ‘emergency’ contracts were awarded at a higher price to leading (and known to be influential) construction firms, waiving the normal contracts, which further led to inflated costs.

Overexploitation of Workers

Construction projects, especially the stadiums, which were left to last-minute completion, had adverse effect on the workers. Many workers were assigned twelve-hour shifts and were asked to give up holidays to finish the construction work in time for World Cup. Some workers reportedly lost their employment as they could no longer tolerate the stress and physical strain. Around eight workers died in accidents on construction sites and these accidents occurred mainly due to lack of safety measures and inhuman working conditions. Many workers that had migrated from rural parts of the country to urban areas in search of World Cup-related employment opportunities complained about poor working and living conditions and under-compensation. Between 2007 and 2014, workers in various parts of the country, supported by labor unions, went on strike demanding their basic rights. Strikes and accidents triggered further delay in construction work related to World Cup.

Projects Financing and Funds Clearance Issues

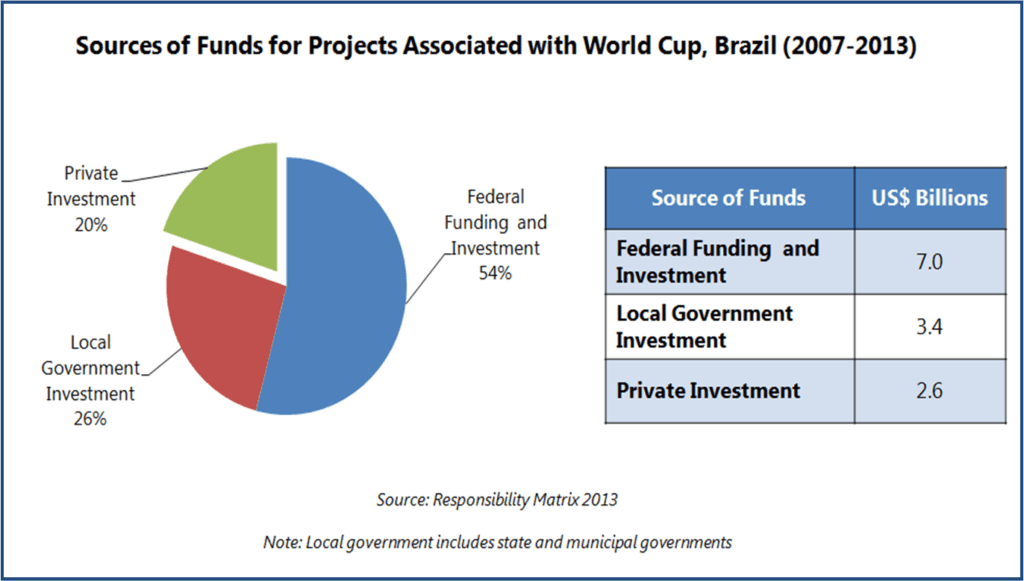
According to Responsibility Matrix 2013, 80% of the total investments in World Cup-related projects were financed through investments and funding from federal, state and municipal governments.
Source of Funds

A larger role from the private sector was anticipated in preparation for 2014 World Cup, particularly for the event-specific projects such as construction of stadiums, and the government was expected to contribute mainly as a facilitator for the event. As the actual contribution from private funding was limited, the strain was passed on to local government budgets. In 2010, on failure to attract private investments for building stadiums for World Cup, the National Bank for Economic and Social Development (BNDES) opened a credit line of US$2.7 billion for completion of the World Cup stadiums. After receiving requests from states for financing, BNDES took up to three months to analyze the proposals and consequently the stadium construction work was further delayed.

Furthermore, complex and time consuming procedures continued to cause delay in funds clearing. According to World Cup Transparency Portal, by March 2014, 89.9% project work had already been contracted out, but payments were done for only 51.2% of them. This was implying increased payments out of local governments’ pockets in the second quarter of 2014, which occurred at the expense of several high-importance sectors such as healthcare or education.

Roadblocks for Micro and Small Enterprise

Around 44,000 enterprises associated with Brazilian Service of Support for Micro and Small Enterprises (SEBRAE), a non-profit autonomous institution promoting competitiveness and sustainable development of micro and small enterprises, are estimated to have earned US$230 million in revenue from World Cup-generated business opportunities from 2007 to 2014, which indicates that several of them were able to take good advantage of the opportunities provided by the event. However, it appears that many small food and FIFA merchandise vendors could have benefited to a greater extent, if they were not deterred to capitalize on large demand generated in the close proximity of stadiums during World Cup by FIFA’s heavy fee of US$8,000 from any non-FIFA approved vendor who wished to operate in a 1.5 km radius of host stadiums. The question is whether such a considerable fee remains in proportion to small and micro vendors’ scale of operations, who after all distribute FIFA merchandize, contributing to the publicity success of the event.

Even the few selected street vendors (estimated at around 1,000) that were granted temporary licenses to sell FIFA sponsors’ goods in the FIFA prohibited zones during the World Cup were not much at advantage. FIFA sponsors were responsible for selecting, contracting, and training the vendors. Proven experience of the vendors in selling goods in the neighborhood was the main the criteria for selection. Vendors were provided with uniforms, authorization cards, as well as goods to sell. Vendors retained a fixed 30% share in revenue from goods sold during the event, which limited their ability to negotiate the profit margins. As these vendors were not allowed to sell goods from non-FIFA sponsors, they lost an opportunity of earning higher revenues by selling locally manufactured or self-produced goods.

Mass Eviction
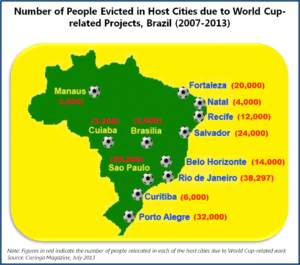
Eviction of People from Host CitiesBetween 2007 and 2013, about 248,297 people were forced to leave their homes due to infrastructure work for the tournament. Social activists claimed that most of the designated areas for relocation were at far distances from former dwellings and were less developed. There have been complaints that the compensations offered by the government to people for relocation were unfair and insufficient.

For instance, in May 2014, AlJazeera reported that in Rio de Janerio compensation sums offered to people for relocation was half the value of their old house, while employment opportunities in relocated areas remain scarce. These people belong to most impoverished communities in Brazil and lack of work opportunities and inadequate compensation may further worsen their condition, which may also lead to increase in crime rate.

Tax Revenue Lost Opportunity

Brazil government was rather generous in giving out tax breaks in relation to various activities associated with 2014 World Cup, and this was considerable revenue lost for the budget. In 2010, the Ministry of Treasury announced tax breaks for the construction and renovation of the stadiums for World Cup. The entities involved in stadium works were granted exemption from Industrialized Products Tax, Importation Tax, or social contributions. In addition, the twelve host cities were granted exemption from State Value Added Tax on all operations involving merchandise and materials for construction or renovation of the stadiums. Furthermore, all expenditure by FIFA in Brazil for World Cup was exempted from taxation. While it is always expected that tax relieve and exemptions are given in such high-profile, national events, it remains doubtful whether Brazil could afford foregoing such tax revenue, especially in the face of many social, structural, and welfare problems eating away the country’s public system.


EOS Perspective

2014 World Cup is believed to have provided a boost to Brazil economy, but this push was not significant enough to upswing economy’s recently sluggish growth. The temporary rise in tourism associated with the event, can, to some extent, offset lowered production and disruptions in the country during the event. However, it is unlikely that gains from this short tournament will make up for the inflated and overrun costs, suspected political corruption, fraudulently spent or lost money, missed opportunities of diverting some of the funds to other sectors, or social damage caused by disregard for dwellers and workers, along with other social costs that follow these deficiencies in a ripple effect. World Cup-generated opportunities benefited mostly construction, hospitality, travel, and tourism sectors.

The improvements and modernization of infrastructure will leave positive legacy for the country, which is a positive outcome, however achieved at a great expense, arguably not comparable with the country’s current financial capabilities. As emotions cool down and more objective analyses are offered by various experts, it is more and more visible that the positive impact of the event on Brazil economy, its people, and businesses is rather short-lived. Over long term, it is likely that Brazil will end up being the loser of the 2014 FIFA World Cup. As the event-generated income sources slowly dry up, Brazil will be left with a huge bill to pay in its hand, one that will have to be settled over years to come.

by EOS Intelligence EOS Intelligence No Comments

Vietnam’s Social Health Insurance – Strong Foundation, Lacking in Support Infrastructure

1.3kviews

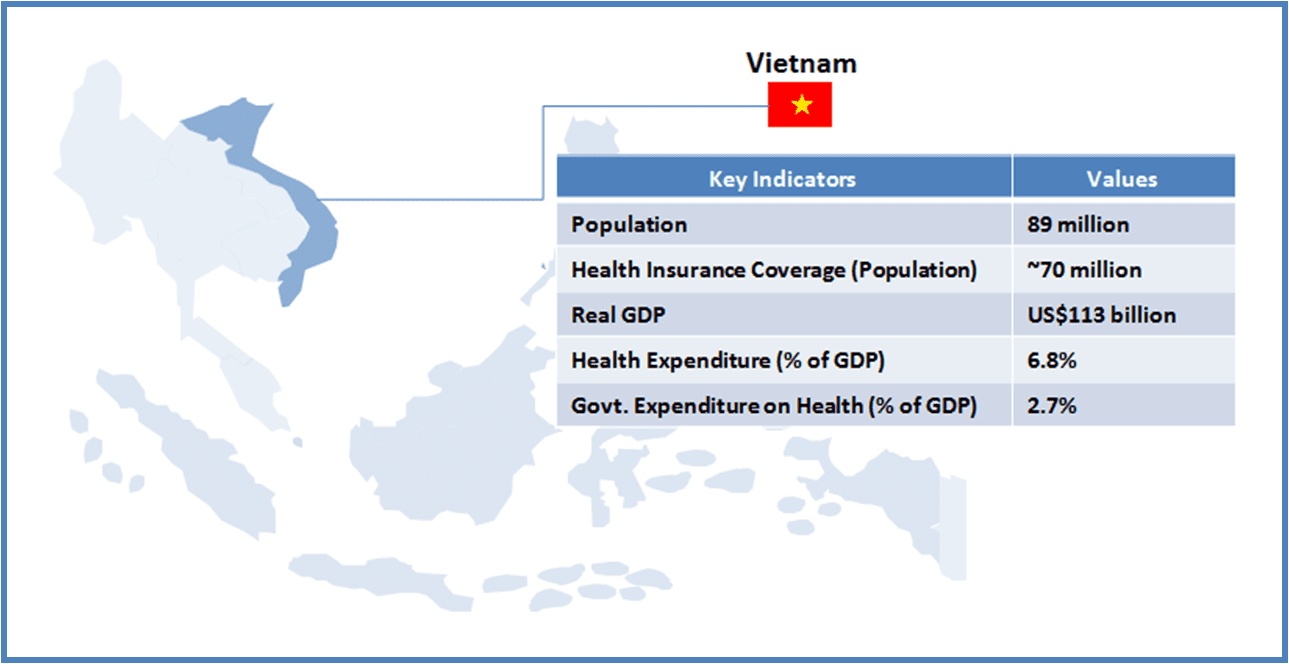
Vietnam is a lower-middle income country (GNI per capita US$1,550 as of 2012) with a population of about 89 million (14th most populous country as of 2012). Entitlement of healthcare to every citizen is imbibed in Vietnam’s constitution, and the country has taken steps to achieve it. National Strategy on Protection and Care of the People’s Health (2001) increased the state’s role in ensuring basic healthcare services to all Vietnamese. The Law on Health Insurance (2008) was formulated with the objective of achieving universal health insurance coverage.


This article is part of a series focusing on universal healthcare plans across selected Southeast Asian countries. The series also includes a look into the plans in The Philippines, Cambodia, Vietnam, Indonesia, and Thailand.


As of 2011, more than 60% population were covered under the Social Health Insurance (SHI) scheme. The government is aiming to cover rest of the population (primarily the people from the informal sector) by 2014.

If achieved, Vietnam would be among few Asian countries with 100% Universal Health Care (UHC) coverage for its citizen. For a private sector player (pharmaceutical company, medical device manufacturer, or a healthcare service provider), this should materialize in to increased sales, as the number of customers (which otherwise are faced with financial constraints to avail healthcare services/products) grow.

Vietnam UHC

However, from a long term perspective, sales prospect are likely to depend on the government’s ability to maintain service levels, to tackle emerging healthcare challenges within UHC mandate, and to ensure availability of finances for SHI. The current design and the support infrastructure would determine the long term success of SHI (and hence the prospects of the companies from healthcare industry).


INFRASTRUCTURE
Key Stakeholders
  • The Ministry of Health (MOH) is responsible for developing programs and policies, budgeting, personnel allocation, direction and supervision of national institutions

  • The Provincial Health Bureau administers the provincial healthcare care system. Each province consists of District Health Bureau responsible for district level administration of the healthcare services

  • The Commune Health Station (CHS) in each district provide healthcare services at Commune Level. District People’s Committee is responsible for the funding of the healthcare services in each district

Healthcare Service Delivery
  • CHS providing primary healthcare services is the entry point in the public healthcare system in Vietnam

  • District hospitals offer basic inpatient treatment, emergency services, and pre-natal and delivery services. Provincial hospitals (including specialty clinics) provide outpatient and inpatient services

  • National hospitals are the most advanced with specialties such as oncology, endocrinology etc.

  • Current hospital infrastructure:

    • HC: ~11,000
    • District Hospitals: ~1,300
    • Provincial Hospitals: ~ 500
    • National Hospitals: ~ 45
    • Private Hospitals: ~ 1,00
KEY CHALLENGES
Regulatory Framework for Private Healthcare

  • Private healthcare infrastructure has flourished in Vietnam as the government intended to reduce burden from the public healthcare system. However, due to lack of regulations, the private system has failed to complement the public one as expected

Burdened Public Healthcare

  • People mostly rely on private system for outpatient care, though they may prefer to visit the public system for inpatient services. Therefore, healthcare at primary level has not developed as expected, putting more pressure on secondary and tertiary healthcare infrastructure

Uneven Concentration of Healthcare Personnel

  • Distribution of human resources is not even, as most of the doctors and support staff is concentrated in the urban centers. Due to it, rural population may not be able to avail the benefits of social health protection, despite being under coverage


DESIGN
Beneficiary Classification

SHI members are classified in to the following six groups:

  • Civil servants and formal sector workers
  • Pensioners, meritorious people, beneficiaries of social security/protection allowances, and veterans
  • The poor and near-poor
  • Children under six years of age
  • School children and students
  • All remaining population
Healthcare Insurance Financing
  • SHI is funded through government budget, employer and employee contribution, and Vietnam Social Security (VSS). The ‘Healthcare Fund’ for SHI is managed by the VSS.

  • SHI premium is fixed at 4.5% of the salary/pension/protection allowance/unemployment benefit wherever applicable. The government pays for the premium of poor, children under six years, and meritorious people. For unemployed and pensioners, VSS pays the premium. Group 5 (from above) is eligible for 30% subsidy in the premium, fully paid by the government

Payment System
  • SHI member are enrolled either at CHS or district hospitals. Capitation system covers all the costs incurred by CHS and district hospitals for providing healthcare services to SHI members.

    • There is a provision for the refund of capitation payment in case the funds are not fully utilized by CHS/District Hospital in a particular year.

    • In case of deficit of funds (i.e. more SHI members than planned avail services in a particular year), the provincial social security office reimburses CHS/District Hospitals

  • Secondary and tertiary hospitals are covered by fee-for-service payment system.

Benefits
  • Inpatient Service – Birth Delivery, Emergency Services, Other inpatient Services (nursing, tests, catering, pharmaceutical)

  • Outpatient – Public health services, primary care services, specialist services, pharmaceuticals, tests, and scans

  • Other Services – Dental care, mental care, dialysis, and transplants

Co-payment (Reimbursement) System
  • For Inpatient Services – Pensioners, poor, and members receiving social protection allowance (5%), others (20%)

  • For Outpatient Services – No co-payment for services at CHS; for others, same as applicable for inpatient services

  • Other Services – Same as applicable for inpatient services

Reimbursement System for Drugs
  • Drugs specified under the reimbursement list (consisting of more than 800 pharmaceutical products as of now) qualify for co-payment system (mentioned above).

  • SHI members can avail co-payment benefit only if the required drug is available at the CH/Hospital they are registered at. There is no reimbursement if the drug is purchased from a private drug store

KEY CHALLENGES
Enrollment of People still Outside the SHI Coverage

  • While there is clarity in the Vietnamese social health insurance beneficiary classification system, a large population still remains outside its ambit. The government needs to introduce a better mechanism to ensure enrollment of the section of the population (e.g. informal sector) who have less incentives to join the scheme (at present), as compared with other groups

Corruption

  • Due to rampant corruption in the public hospitals, the patients have to pay extra despite a well defined payment mechanism, or else the services are alleged to be unavailable despite being under social health insurance coverage.

Adequate Funding Mechanism to Ensure Long-term Viability of SHI

  • As the population under coverage increases, the government may need a better taxation policy to fund the services or else the Health Fund is expected to fall short to meet expenses. In 2013, VSS proposed the government to increase health insurance premiums from 4% to 6%, which the government declined in view of the weak economic condition.

Opportunities for Healthcare Companies

Healthcare Service Providers

  • Contractual healthcare services are not a popular trend in Vietnam; however, subjected to a robust regulatory framework with respect to its linkage with the social healthcare insurance system, private players have considerable opportunities to complement the overburdened public healthcare system in the country

Medical Device Manufacturers

  • There is a critical shortage of medical devices, such as MRI, Tomography scanners, mammography, etc. in public hospitals. With the SHI, public hospitals would need to purchase such equipment, to cater to the increasing demand, this providing a platform for medical device manufacturers in the country

  • There is a provision for private investment in public hospitals for the purchase of medical equipment. Greater opportunity lies in provincial hospitals, which lack medical equipment despite witnessing a large number of patient visits every year

Pharmaceuticals Companies

  • Vietnam is among few countries, which cover outpatient cases under the social health insurance system

  • Pharmaceutical companies have significant potential to increase sales as a result of wider coverage (once SHI is implemented), and by focusing marketing and sales efforts on the inclusion of their drugs in the reimbursement list

A Final Word

One of the key priorities for the Vietnamese government is to meet the target of 100% population coverage. For a populous country, such as Vietnam, the public healthcare system is hamstrung by the lack of infrastructure (a crucial factor in determining the success of UHC in the long term), which is aggravated by the concentration of healthcare in specific regions (e.g. urban centers). Design of Vietnamese UHC appears to be robust in terms of clarity in beneficiary classification and wider coverage of healthcare services (e.g. outpatient services). However, to ensure success, the government would be required to bring the informal sector population within the UHC ambit.

For healthcare industry participants, there are opportunities for pharmaceutical as well medical device manufacturers, with the expected expansion of public healthcare services in Vietnam. There may be a case for healthcare service providers as well in case the government decides to experiment with contractual healthcare services (to compensate for the lack of public healthcare infrastructure).

A comparative with other countries in the region should provide a better perspective on the actual potential of Vietnam as a prospective destination for devices and drugs companies alike.

by EOS Intelligence EOS Intelligence No Comments

Cambodian Healthcare – In Need of Strong Government Support

1.1kviews

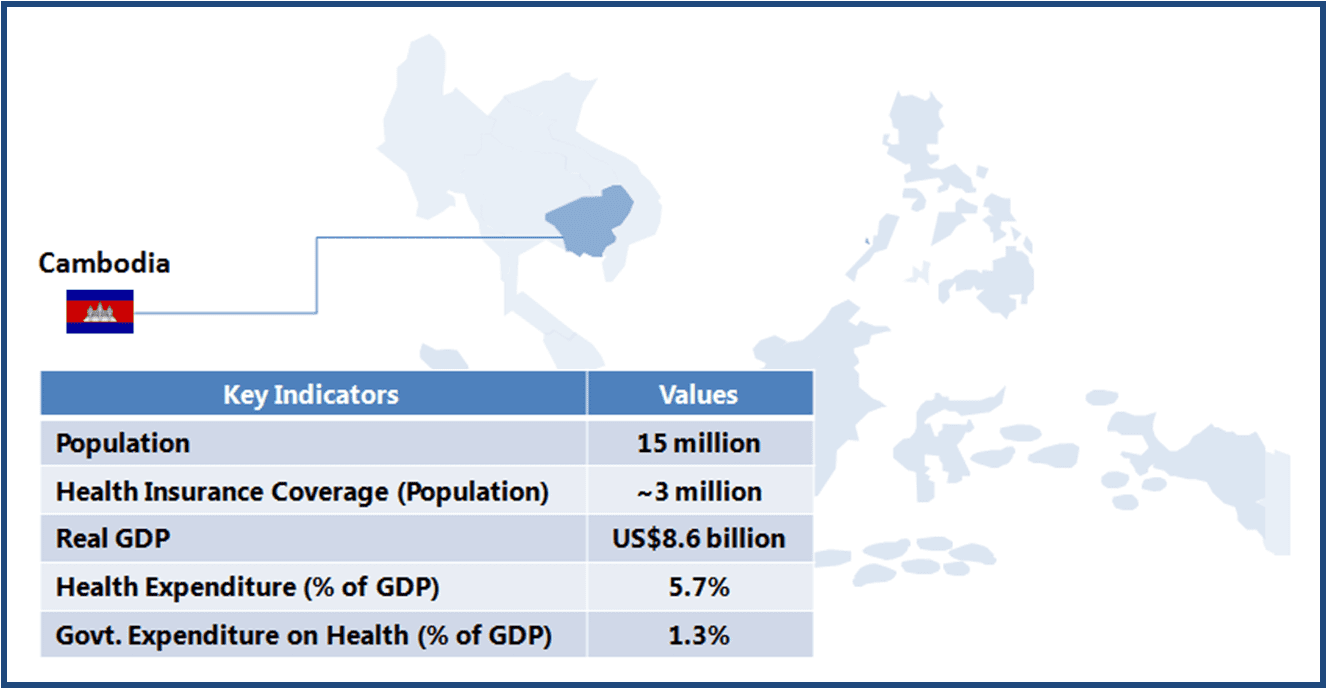
Cambodia is a low income country (GNI per capita US$880 as of 2012) with a population of about 15 million (67th most populous country as of 2012). Though the country has witnessed concentrated efforts towards better healthcare infrastructure and services since gaining independence in 1953, the major push came only in 1993 after the establishment of a dedicated Ministry of Health (MOH). The MOH has been consistently working to overcome major healthcare-related challenges, such as widespread malnutrition, high mortalities from communicable diseases, and low access to healthcare. MOH’s Health Sector Plan (HSP) (2008-2015) focuses on developing healthcare infrastructure and ensuring that healthcare services reach the entire population.


This article is part of a series focusing on universal healthcare plans across selected Southeast Asian countries. The series also includes a look into the plans in The Philippines, Cambodia, VietnamIndonesia, and Thailand.


Social Health Insurance (SHI) is still in early stages of implementation, and will take some years before it is firmly established. The SHI Master Plan was launched in 2003 with an aim to develop a stable financing system, and to promote equity in healthcare access. Currently, people from poorer sections of the society and informal sector are covered through Health Equity Funds (HEF) and Community-based Health Insurance (CBHI) Plans. The government plans to introduce a single health financing system by 2015.

Cambodia UHC

About 2.5 million poor and more than 500,000 individuals from the informal sector are covered by HEF and CBHI plans, respectively.

When implemented fully, SHI is expected to provide healthcare protection to urban and rural poor (among others). The success of SHI would depend on the government’s ability in establishing healthcare infrastructure in places where it is currently unavailable, devising a suitable taxation/financing mechanism to support it, and in ensuring an optimum coverage of health conditions. The current design and support infrastructure would determine the long term success of SHI.


INFRASTRUCTURE
Key Stakeholders
  • The Ministry of Health (MOH) is responsible for health policy and planning, coordinating among various sectors within the healthcare sector, and for securing external aid
  • The Provincial Health Department (PHD) connects the MOH to operational districts (OD) through the implementation of policies in the HSP via the annual operations plan (AOP)
  • OD is the primary entry point of the population into the health system; Each OD, comprising a network of health centers and a referral hospital, covers a population between 100,000 to 200,000; health centers are geographically located so as to serve a catchment area of between 8,000 and 12,000 people
Healthcare Service Delivery
  • Public healthcare service delivery is designed to offer services at two levels — a) minimum package of activity, available at health centres; b) complementary package of activity (CPA), available at referral hospitals
  • Minimum package includes (among others) initial consultations, primary diagnosis, emergency first aid, chronic disease care, and maternal and child care
  • Based on the CPA offered, referral hospitals are categorised into:
    • CPA1: Basic obstetric services, provided mostly by district hospitals
    • CPA2: Basic obstetric services, large scale surgery, ICU facility, and other specialized services, such as ENT, dental, etc.; services are primarily provided by district hospitals and a few provincial hospitals
    • CPA3: More advanced than CPA2 with a wider range of specialty services; all national hospitals and most provincial hospitals come under this category
  • Current hospital infrastructure:
    • Health Centres: ~1,100
    • CPA1: ~33
    • CPA2: ~ 31
    • CPA3: ~ 26
    • Private Clinics: ~ 1,500
KEY CHALLENGES
Lower Adoption of Public Healthcare Services

  • Despite an established referral system with primary care facilities, private clinics are the first point of contact for Cambodians. Poor access and inadequate service delivery have been major issues affecting the adoption of the public healthcare system
    • Level of expertise is still low among public sector healthcare workforce; this is one of the key focus areas for the government if it intends to improve adoption of public facilities
    • Cambodia has successfully experimented with the outsourcing of healthcare services; this can be continued to achieve efficiency at primary and secondary level, while investing public resources on tertiary level services

Less Efficient Procurement System

  • SHI may not serve the purpose if medicines covered under it are not available and patients continue to rely on private pharmacies; the procurement system needs to be overhauled with better demand estimation and/or more autonomy for purchase at the OD level
  • Bringing in technology into the procurement system should help in developing an efficient system


DESIGN
Beneficiary Classification
  • At the launch of SHI Master Plan, following four groups were envisaged:
    • Wealthy (5% of the population)
    • Urban Formal Sector (10% of the population)
    • Urban and Rural Near Poor (50% of the population)
    • Rural and Urban Poor (35% of the population)
Healthcare Insurance Financing
  • The expenditure on public healthcare services is provided through taxation revenues and external aid; MOH also funds (partially) the HEFs and CBHI schemes
Payment System
  • Cambodia follows a user-fee model for the payment of healthcare services; all public healthcare facilities charge user-fee for the provision of services
  • In case of HEFs, user-fee has been standardized across all ODs where the scheme has been implemented
  • CBHI pays to health centers/hospitals on either case per basis or on the basis of capitation system, depending on the arrangement with local OD
Benefits
  • Current health insurance schemes cover minimum and complementary packages offered by the public healthcare system
Co-payment (Reimbursement) System
  • The government subsidizes minimum and complementary packages (for equipment, facilities, and staff salaries) and medicines (covering essential medicines); service users have to pay for the consultation and treatment fee, and out of stock medicines
  • HEF covers partial or full costs of access to services for poor, including user-fees and cost of transportation
  • CBHI covers full cost of access to services for the informal sector population under coverage, including user-fees, cost of transportation, and the cost of referral and admission in provincial hospitals
Reimbursement System for Drugs
  • Drugs specified under the reimbursement list managed by the MOH are reimbursed; MOH is responsible for the procurement and distribution of drugs to the referral hospitals and health centers at operational districts
  • Drugs mostly covered are for in-patient services; for OPD patients, there is no such provision, except for the prescription of a cost-effective generic formulation
KEY CHALLENGES
Lack of Funding Mechanism to Ensure Long-term Viability of SHI

  • Success of the SHI would largely depend on its funding mechanism, which at present depends on taxation revenue and external aid; the government will have to look for increased funding for SHI, which may be in the form of a) increased healthcare budget allocation (from current 1% of the GDP), b) SHI-specific tax/surcharge, c) introduction of premium for top 15% (income-wise) of SHI beneficiaries
  • Participation of informal sector (with no fixed income) is crucial for the success of SHI – a review is required to assess what additional incentives that can be added to the current CBHI scheme (for informal sector) to encourage participation; this may be helpful once a unified financing system is implemented in 2015 (as planned)

Opportunities for Healthcare Companies

Healthcare Service Providers

  • Outsourcing healthcare services has proven to be an effective way to improve the performance of the healthcare system in Cambodia. Therefore, the outsourcing of services may continue in the future as well, providing opportunities to healthcare service providers

  • Experienced service contractors help in fulfilling the goals set-out in HSP (2008-2015, especially the Millennium Development Goals) where the country appears to be lagging

Medical Device Manufacturers

  • There is severe lack of medical devices, such as MRI, tomography scanners, mammography, etc. in public hospitals. SHI aims at providing such facilities, even if outsourced to private players

  • Increased in-patient coverage is likely to result in demand for devices such as patient monitoring equipment

Pharmaceuticals Companies

  • SHI implementation may not bring any additional benefits to pharmaceutical companies, as OPD drugs are not included as part of the benefits

  • Demand for in-patient drugs is likely to increase; the focus of pharmaceutical companies would remain on the inclusion of their drugs in the reimbursement list

A Final Word

The SHI system is still in early stages of development in Cambodia and the government needs to work on both infrastructure and design to ensure success of the scheme. SHI will be effective only if the people under coverage avail healthcare services through it, for which government healthcare services need to be at par with the private system. Provision of OPD services under SHI coverage will also help in greater adoption of the scheme.

Participation of the informal sector population is key to the success of the scheme from a financial perspective (ensuring adequate funds and lower reliance on foreign aid), and for meeting the key objective of ‘healthcare to all’.

From the perspective of healthcare industry participants, Cambodian healthcare service providers are likely to gain the most if the government expands services to a larger set of population (based on positive outcome from previous experiments). On one hand, lack of adequate equipment provides a strong opportunity for medical devices companies, while on the other hand, the expansion of in-patient services (as more people are covered by SHI) should provide an impetus to pharmaceuticals companies. For pharmaceuticals companies, the growth potential may not be fully realized unless OPD services are also covered under SHI.

———-
Notes:

  1. Health Equity Fund (HEF) are schemes to support vulnerable groups, supported by the Health Sector Support Program and funds from various development partners and the national budget
  2. Community-based Health Insurance is a voluntary, community-based and not-for-profit health insurance
  3. About 35% of the total population lives below the poverty line, earning US$0.45-0.60 per day
by EOS Intelligence EOS Intelligence No Comments

Philippines’ Universal Healthcare – A Promising System Plagued by Inconsistent Quality of Service Delivery

1.8kviews

Over the years, governments across emerging markets have realised how critical universal healthcare coverage is for their population. While some countries have taken the challenge head-on, others have followed a wait-and-watch policy to see how such systems are being implemented, and gradually adopted a system that is based on the good practices of several healthcare plans.

In recent years, several Southeast Asian countries have adopted different forms of universal healthcare plans for their countries. Universal healthcare-related policies and delivery mechanisms were largely based on existing healthcare systems, a result of gradual development (based on local factors and priorities). Therefore, while theoretically universal healthcare exists (wherever applicable), it differs in terms of the actual benefits (e.g. quality and range of services and monetary advantage to patients).

We review these plans across a few Southeast Asian countries, to understand their infrastructure and design, and available opportunities for healthcare service providers, medical device manufacturers and pharmaceuticals companies. As part of this series, we start with Philippines, where about 80% of the population is currently covered under the universal healthcare plan, called PhilHealth.


This article is part of a series focusing on universal healthcare plans across selected Southeast Asian countries. The series also includes a look into the plans in The Philippines, Cambodia, VietnamIndonesia, and Thailand.


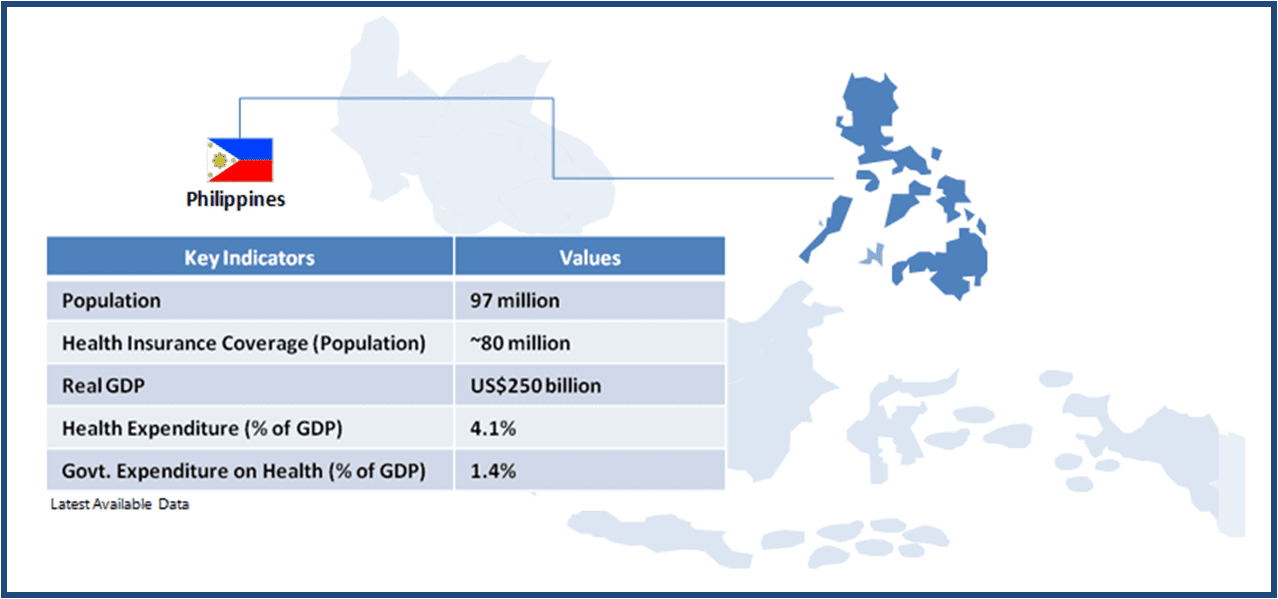
The Philippines is a lower-middle income country with a population of about 97 million. In spite of a strong focus on healthcare services, inequality in terms of healthcare access to various socio-economic groups and regions remains a persistent issue. Achieving universal healthcare access for all its citizens is a key objective of the government’s National Objectives for Health (2011-2016) program, and the government aims to fulfil three primary goals through this program – 1) financial risk protection; 2) better health outcome; 3) responsive healthcare system.

The first step towards universal healthcare was the launch of Medicare (1969), which provided health insurance to formal sector (public and private) employees. Coverage was extended to the poorer section of the population and the informal sector with the creation of PhilHealth (Medicare was merged with it) in 1995.

As of 2013, more than 80% of the country’s population was covered under the national health insurance program PhilHealth. The government aims to provide 100% coverage by 2016.

Philippines UHC

For a private sector healthcare player (pharmaceutical company, medical device manufacturer, or healthcare service provider), a country with 100% insured population presents strong incentives in form of greater access to diverse sections of the population with varied service and product needs, which will inevitably drive sales. However, to maintain the effectiveness of universal healthcare coverage, the government needs to work beyond simply the numerical (on paper) coverage of its population under the health cover to ensuring informal sector participation in the scheme, consistency in service delivery at primary care level, and adequate coverage of diseases.

The long-term success of social health insurance (and related with it, the prospects for healthcare sector stakeholders) will be determined primarily by how PhilHealth has been designed and what emphasis is being laid on infrastructure.

We take a closer look at these two critical aspects of the universal healthcare program.

INFRASTRUCTURE
Key Stakeholders
  • The Department of Health (DOH) is responsible for developing programs and policies, monitoring standards, and provision of specialized and tertiary level care
  • DOH is represented at the regional level by centres for health and development (CHD), which link national programs with local government units (LGU); provincial administration (including hospitals and primary care) fall under each LGU
  • LGU administers healthcare services through Health Boards at the provincial (led by the governor), city (led by the mayor), and municipal (led by municipal mayor) levels
  • Barangay (village) is the smallest administrative unit with primary health station/health centre
Healthcare Service Delivery
  • Public hospitals account for about 40% of approximately 1,800 hospitals in the Philippines
  • Based on the range and quality of services offered, hospitals are classified into four levels:
    • Level 1: general hospital with maternity ward, dental clinics, 1st level X-ray, secondary clinical laboratory with consulting pathologist and blood station, and pharmacy
    • Level 2: Level 1 facilities + respiratory units, ICU, NICU, HRPU, tertiary clinical laboratory, and 2nd level X-ray facility
    • Level 3: Level 2 facilities + plus teaching/training, physical medicine and rehabilitation, ambulatory surgery, dialysis, tertiary laboratory, blood bank, and 3rd level X-ray
    • Level 4: Specialty hospitals with treatment facilities for health conditions such as bones, heart, lungs, etc.
  • Current hospital infrastructure:
    • Level 1: ~ 352
    • Level 2: ~ 276
    • Level 3: ~ 41
    • Level 4: ~ 51
    • Private Hospitals: ~ 1,120
KEY CHALLENGES
Overlaps in the referral system

  • Despite a highly decentralized healthcare delivery system, there are overlaps in the referral system in which district hospitals also act as the entry point into the country’s healthcare system. This may result in overcrowding of district hospitals, under-utilization of primary care centres, and loss of efficiency (patients being referred back to their local villages)

Variance in quality of healthcare service delivery

  • Provision and quality of services largely depend on the LGU administration, where local funding plays a crucial role. Healthcare is one of several areas that fall under the administrative regime of an LGU; it has been observed that healthcare prioritization varies by LGU, implying that the quality of healthcare service delivery by LGU, leading to variance in service levels across the country


DESIGN
Beneficiary Classification
  • PhilHealth members are classified into four groups
    • Group 1: Formal sector employees
    • Group 2: Self-employed professionals, members of the agricultural sector, and members of the informal sector
    • Group 3: Retirees and pensioners who are at least 60 years old and have made 120 monthly contributions to PhilHealth
    • Group 4: Poorest segment, belonging to the lowest 25% of the Philippine population and families listed in the National Household Targeting System for Poverty Reduction (NHTS-PR)
Healthcare Insurance Financing
  • PhilHealth is mainly funded through government taxation, and employer and employee contribution
  • Premium is fixed at 2.5% for formal sector employees (Group 1)
  • Group 2 members fall under the individual paying program – those with less than P 25,000 monthly income pay P 2,400 as yearly premium, and those with over P 25,000 cut-off pay P 3,600 annually
  • Group 3 and 4 are not required to pay any premium
Payment System
  • Hospitals work under fee-for-service system, and are paid by PhilHealth for a defined set of services; reimbursements are paid directly to service providers
  • DOH has identified 25 health conditions under case-payment (covers total cost per case) for PhilHealth cardholders
Benefits
  • A defined set of services at pre-determined rates are covered by the PhilHealth scheme, and patients are required to pay out-of-pocket beyond the rate ceiling; coverage includes cost of medicines, supplies, and diagnostics during hospitalisation
  • Outpatient consultations are not covered under PhilHealth; only a handful of health conditions, such as asthma, gastroenteritis, upper respiratory tract infection, and pneumonia qualify for treatment under the insurance plan
Co-payment (Reimbursement) System
  • The PhilHealth system does not work on the principle of fixed-percentage co-payment system; patients (irrespective of the beneficiary group it belongs to) are required to pay the balance if the cost-of-service goes beyond a pre-determined ceiling for a particular service
  • Ceiling rates may vary for the same service; higher ceiling rates are applicable for patients visiting specialty level hospital facilities
  • For the 25 health conditions under the case-payment system, baseline benefits can range from 50% to 100%; DOH is also implementing a zero co-payment policy for beneficiaries under the sponsored program (Group 4 beneficiaries) for the 25 disease defined under case payment
Reimbursement System for Drugs
  • Drugs, listed in the Philippine National Drugs Formulary, and required during hospitalisation are covered under PhilHealth; minimum ceiling rates (for single confinement period) for medicines according to the hospital level are the following:
    • Level 1: P2,700
    • Level 2: P3,360
    • Level 3: P4,200
KEY CHALLENGES
Enrolment and recognition of actual beneficiaries by group

  • Enrolment of population representing the informal sector into PhilHealth is a challenge, as due to their irregular income levels, beneficiaries under this category do not enrol or pay the mandated premium
  • Also, identification of the poorest segment of the population, forming the sponsored category, is a grey area as the system is unable to ensure clear distinction between the entitled population versus those from other groups

Inadequate monitoring of service delivery

  • PhilHealth mainly provides in-patient benefit with low financial protection due to the ceiling system
  • Due to apparent lack of check on the fees charged by hospitals, even higher ceilings do not benefit patients, as hospitals raise their cost of services; consequently, the actual number of people availing its services appears to be significantly low
    • For instance, in 2011, PhilHealth’s share in the country’s total healthcare expenditure was only 9.1% vis-à-vis out-of-pocket share at 52.7%; the rest 38% was government’s expenditure on healthcare other than PhilHealth

Opportunities for Healthcare Companies

Healthcare Service Providers

  • Significant Public Private Partnership (PPP) opportunities in exist in Philippines’ healthcare sector, to raise the level of services and to extend the coverage

  • Currently, only a 700-bed orthopaedic centre is being operated under the PPP model, and according to Philippine’s Health Secretary, there is significant opportunity for the PPP model in all DOH managed hospitals

  • The only roadblock for the adoption of PPP model is the perception of it being a move towards privatization of healthcare services (given that private sector already dominates the healthcare space in Philippines)

Medical Device Manufacturers

  • Public hospitals (especially those under LGU administration) usually are short of resources for the procurement of medical devices (mostly imported), which constraints them in providing patients with critical diagnostic services; this remains an area of concern as available devices will be inadequate to meet the 100% population coverage target of PhilHealth

  • At the same time, the demand for devices remains robust, and growth is expected on account of increase in the number of people under coverage as well as greater availability of healthcare services across the country. In order to further boost demand, medical device companies could explore ways to finance the purchase, so as to motivate hospitals to purchase equipment

  • The DOH has also hinted that critical equipment, such as CT scans and MRI machines, can be procured under a PPP model, providing an alternative option for device manufacturers to widen their presence

Pharmaceuticals Companies

  • In the current scenario, scope for pharmaceuticals companies is limited to medicines used for inpatient treatment. Sales potential is likely to increase as the government introduces zero co-payment policy for 25 health conditions for the sponsored category beneficiaries

  • Also, with the proposed widening of treatment coverage to include conditions such as hypertension and diabetes (was expected to come into effect in October 2013) which affect about 20% of the adult population, sales prospects is likely to improve

A Final Word

Philippines’ universal healthcare plan, PhilHealth, provides a strong foundation for access and quality enhancement of healthcare services to its population. With coverage of about 80% of its population currently, the country’s healthcare policy has tried to provide equality of service delivery to its citizens, and covers a range of common diseases and inpatient treatments. While there are obvious concerns around inadequate hospital facilities and diagnostics equipment, issues with accurate entitlement of benefits and inadequate monitoring of service delivery, the country’s healthcare administration is working with private partners to strengthen the system and focus on providing quality healthcare to its citizens.

From the perspective of healthcare industry participants, hospital services companies perhaps have a higher potential for growth in view of the shortage of hospital facilities across the country, while drugs companies must continue to rely on limited access to inpatient treatment facilities, providing drugs for the most common diseases (perhaps, also the cheaper product variants of their portfolio).

by EOS Intelligence EOS Intelligence No Comments

India – Reducing Reliance on Diesel

338views

  • India’s subsidy on diesel currently stands at about INR 950 billion (~ USD 19 billion).
  • Total diesel consumption was 64.74 million tons in 2011.
  • Diesel accounts for about 38% of India’s total fuel consumption.
  • 3 million ton of diesel is consumed in private power generation.

On 17th January 2013, the Indian government took a major step towards the deregulation of diesel prices. A monthly (duration, undecided) hike of INR 0.50 (USD 0.01) for retail customers and INR 11.00 (USD 0.20) increase in diesel price for bulk customers has been proposed. This move is expected to reduce India’s fuel subsidy burden by about INR 150 billion (~ USD 3 billion) annually.

Why such high dependence on diesel?

Agriculture and power generation account for 20% of India’s diesel demand.

The agriculture sector, the mainstay of India’s economy, accounts for about 12% of India’s total diesel demand. For a typical Indian farmer engaged in semi-mechanized farming operations, diesel can account for up to 20% of the input cost. This primarily consists of expenses towards fuel used to plough field and a substantial amount used to operate water pumps for irrigation purpose.

The power sector demand for diesel is largely driven by inadequate and inefficient power generation, transmission and distribution infrastructure. As per available statistics, there is about 10% supply-demand gap in India’s power sector, which results in regular outages. Though India added about 20GW of generation capacity in 2011, more would be required if the country aims to match global per capita electricity consumption standards of 2,700Kwh. At present, India’s per capita consumption is about 900Kwh.

This mismatch in supply-demand of power is met by private power generation, accounting for 8% of India’s diesel demand. Shopping malls, housing societies, large hospitals and telecom towers are among the major consumers of diesel-generated power.

  • Across the country, diesel generators operate for 8-10 hours every day, to supplement government-supplied electricity, thus leading to excess demand for diesel.

  • According to government statistics available for 2011, private power generators and mobile phone towers consumed 4.6% and 1.93% of diesel, respectively.

Power is also lost in the form of aggregate technical and commercial losses, which amount to about 30% of the total power produced in the country. With a generation capacity of 205GW, approximately 60,000MW is lost while transmitting and distributing power to end-users.

  • As an indicator, reduction of these losses by even 50% can ensure power to about 8 million diesel pumps of 5 HP rating thereby saving of about 4-8 million litres of diesel per hour.

  • If the government took necessary steps to improve power availability by 50% of the current outage time (assumed to be eight hours daily as an average) then it is estimated that it would lead to the reduction of diesel usage in private power generation by about 4.5 million litres annually.

So, how can the heavy reliance on diesel be reduced?

  • Reduce price differential – Minimizing the price differential between petrol (gasoline) and diesel, which can be up to 30%, could go a long way in helping reduce the burden on diesel. Artificially-kept low diesel prices (coupled with better efficiency of diesel engines vis-à-vis petrol engine) have led to increased demand for diesel vehicles in India, thus resulting in greater diesel consumption. In 2012, diesel cars accounted for more than 50% of all passenger vehicles sold in India. In 2011, approximately 16% of diesel sold in India was consumed by passenger vehicles. Economists have often questioned the rationale behind selling subsidized diesel to passenger vehicle owners who can afford it at the market price. Policymakers have also mulled options to discourage the sale of diesel cars, which include higher taxes on diesel cars. However, such moves have been opposed by the Indian automobile industry. Industry experts admit that parity in diesel and petrol prices can shift balance in favour of petrol vehicles with a sales ratio of 55:45. For instance, if achieved in 2013, this could reduce the consumption of diesel by 200 million litres (based on a conservative estimate).

  • Alternate sources of power – Adoption of renewable sources of energy for power generation could also help in reducing the current diesel burden of India. Renewable power currently accounts for only about 12% of total installed capacity. For instance, an Indian telecom service provider Airtel has installed a 100 KW solar power plant in one of its major routing centres in Northern India. This is expected to save 26,000 litres of diesel annually. The company is planning to install similar system in six other locations as well.

  • Other measuresBetter roads and highways would result in improved fuel efficiency of vehicles leading to lesser use of vehicles. Efficient intermodal logistics infrastructure, with a larger share of railways would reduce dependence on road transport.


Diesel demand in India would remain high due to its close linkage with day-to-day economic activity. However, it is apparent that current diesel usages are more than the actual requirement due to infrastructural shortcomings in the power sector. Therefore, addressing these issues would directly help in reducing diesel demand in India.

In the near term, it would be interesting to see how the gradual hike in diesel prices impact the economy at large, and more so, the budgets of the common man. As with several such measures in the past, the step towards change has to be politically driven and with general elections in sight in 2014, only time will tell how effective this much awaited reform is for India.

by EOS Intelligence EOS Intelligence No Comments

Australia – Stepping on to the Mine Field

320views

While most developing countries have been negatively impacted by the significantly deteriorated economic conditions in the US and European markets, Australian economy appeared to be largely shielded from the impact of the global economic slowdown thanks to its mining industry. Following the onset of the 2008 crisis, when most developed economies slowed down, China continued on its path of infrastructure development and investment. This boosted its demand for minerals and resources, large part of which continue to be imported from mines across Australia.

Thanks to the Chinese economy growth sprint, Australian mining industry has been in a boom mode since 2006, and consequently witnessed soaring levels of capital investment in mining and related logistic infrastructure. The industry growth was significant enough to have resulted in higher dependency of Australian economy on this sector, with the mining and mining-related service industries accounting for about 20% of GDP in 2011-12, compared with only 10% a decade earlier.

The industry is still on a roll, yet the situation might change soon. With the Chinese economy showing signs of slowing down in 2011 and 2012, the Australian government and business executives can no longer be certain of the continuous inflow of Chinese orders for Australian mining output. But the decline in orders is just part of their worries, as mining companies operating across Australia are faced with other challenges as well, which question their ability to remain competitive in the global market.

The Challenges

While currently it is estimated that the strong performance of the Australian mining sector will continue till at least 2014, there are already growing challenges in the industry. Slackening demand, particularly from the Chinese infrastructure sector, has lead to a global drop in commodity prices of coal and iron. This decline in prices, coupled with higher operating costs due to rise in employee wages and energy costs, makes it less economical for Australian ore extractors to trade in global markets.

Skills shortage and union pressures further drive the operational costs upwards. A shortfall in skilled personnel is likely to result in employees being available only at a premium, leading to further increase in costs. A shortage of truck drivers in mining sector has seen employees of large companies, such as Rio Tinto and Xstrata, receive as much as three times their base salary. The insufficient talent is also witnessed in more skilled and experienced jobs, including mine planning engineers, geologists, metallurgists and mineral processing engineers. This skill shortage also gives employee unions an upper-hand when it comes to negotiating perks.

The rise in costs is further multiplied by the introduction of additional taxes, including the Carbon Tax and the Mineral Resource Rent Tax, all of which contribute to the rising cost burden of the Australian mining companies.

At the same time, mining productivity has resurfaced as an increasingly relevant issue. According to 2012 estimates by the Mineral Council of Australia, productivity in mining industry has reduced by about 30% since 2003.

These challenges are a visible sign that Australia’s mining sector is likely to have an increasingly harder job to compete with mining companies in other emerging resource-rich countries, such as Indonesia, whose proximity to important Asian customers results in lower shipping costs to the client. This could result in a considerable decline in Australian mineral exports, and thereby, have a negative impact on the Australian economy as such.

The Way Out

Both the government and mining companies are devising ways to overcome the challenges posed by these increasingly pressing issues.

Expecting that the current peak in mining investment boom will soon be followed by the sector’s decline, the Reserve Bank of Australia (RBA) announced cuts of cash and lending rates in December 2012. Concerned by the fact that the non-mining industries in Australia continue to struggle, RBA has introduced these cuts to support the underperforming non-mining sectors, such as housing, construction, and retail. While the short-term outlook for non-resources investment is likely to remain subdued, these cuts are expected to provide impetus for investment in these sectors over a long term.

Mining companies face a tougher task to remain competitive in the global market. In the short-term, several Australian mining companies are looking at temporary shelving of investment projects to deal with the deteriorating demand and decline in commodity prices. For instance, BHP Billiton, the world’s largest mining company, shelved its Olympic Dam and Bowel Basin projects after witnessing a decline in profits.

However, putting investment projects on hold is not enough and mining companies will have to continue to undertake initiatives to tackle the problem of increase in cost per ton of output.

  • Initiatives to raise employee productivity are being put in place. In 2012, a contracting company overseeing work on Chevron’s $52 billion Gorgon gas project banned sitting during working hours to improve operational productivity.

  • Companies are trying to explore alternatives to tackle skill shortage. Rio Tinto has started employing driverless trains and trucks to cart iron ore from its mines in order to tackle the premium wage demands, caused by the shortage of drivers in mining operations.

  • Companies are cutting employee perks to lower wage costs and offset lower returns. In 2012, Fortescue Metals Group scrapped weekly staff barbecues, and removed free coffee and ketchup from the canteens.

While these initiatives might attract negative publicity, particularly with labour unions, these steps have become increasingly necessary for mining companies to get back on the path of competitiveness and profitability over a long run. But will this be enough? Will cutting weekly employee get-togethers, and making workers stand at work take care of 30% productivity decline witnessed over the past decade? These measures definitely appear disproportionate to the problem’s weight. Or do the Australian mining executives have some more tricks up their sleeves that will actually matter in prolonging the mining sector golden years?

Top